Validation by comparing QoI distributions
This tutorial shows how to use a Validation Similarities pattern in EasyVVUQ.
We test here two quantities of interest (QoI) represented by two analytical functions with Gaussian uncertainties.
The first function is a parabolic function:
mu1 = (y - 50.)**2 / 500.
sig1 = 0.2
dist1 = chaospy.Normal(mu1, sig1)
The second function a constant but with changing uncertainty on one side:
mu2 = 2.5
sig2 = 0.1 + 0.01 * y
dist2 = chaospy.Normal(mu2, sig2)
In the upper pannel of the figure given below, you see how these functions look when we are varing y in the intervalle [0, 100].
Validations metrics
In EasyVVUQ, we implemented the calculation of three different metrics: Hellinger, Jensen-Shannon and Wasserstein (cf. references below for more details). This allows us to compute distances between two QoI distributions.
QoI distributions
We can use Chaospy to compute the probability densities and the cummulative distributions functions needed for the above-mentioned metrics:
# Probabily densities: for Hellinger and Jensen-Shannon
p1 = dist1.pdf(x)
p2 = dist2.pdf(x)

# Cummulative distributions (with weight): for Wasserstein
dx = x[-1] - x[0]
c1 = dx * dist1.cdf(x)
c2 = dx * dist2.cdf(x)
The sampling values x can be computed using the min/max values of a common large support of QoI distrubtions, for example:
x = np.linspace(min_value, max_value, 1000, endpoint=True)
Note 1: The min/max values can be obtained from lower and upper bound of the distributions. In case of univarainte distribution, we can use: dist.lower[0] and dist.upper[0].
Note 2: Distribution based on samples
To build QoI distribution from list of samples that resutls fron UQ simulations, observations or measurements, we can use:
dist = chaospy.SampleDist(samples)
It estimates a distribution from the given samples by constructing a kernel density estimator (KDE).
Validate similarities
Once probabily densities functions (or Cummulative distributions) are comupted for each QoI, we create a validater, object of EasyVVUQ, and get the distance using compare routine. We can use for example Hellinger metric by comparing two lists of probabily densities, pdf1 and pdf2:
# Validater based on Hellinger metric
validater = easyvvuq.comparison.ValidateSimilarityHellinger()
distance = validater.compare(pdf1, pdf2)
The complete code for this example, using other metrics, can be found here.
Finally, in the lower panel of the the different distances between QoI 1 and Qo 2 are displayed:
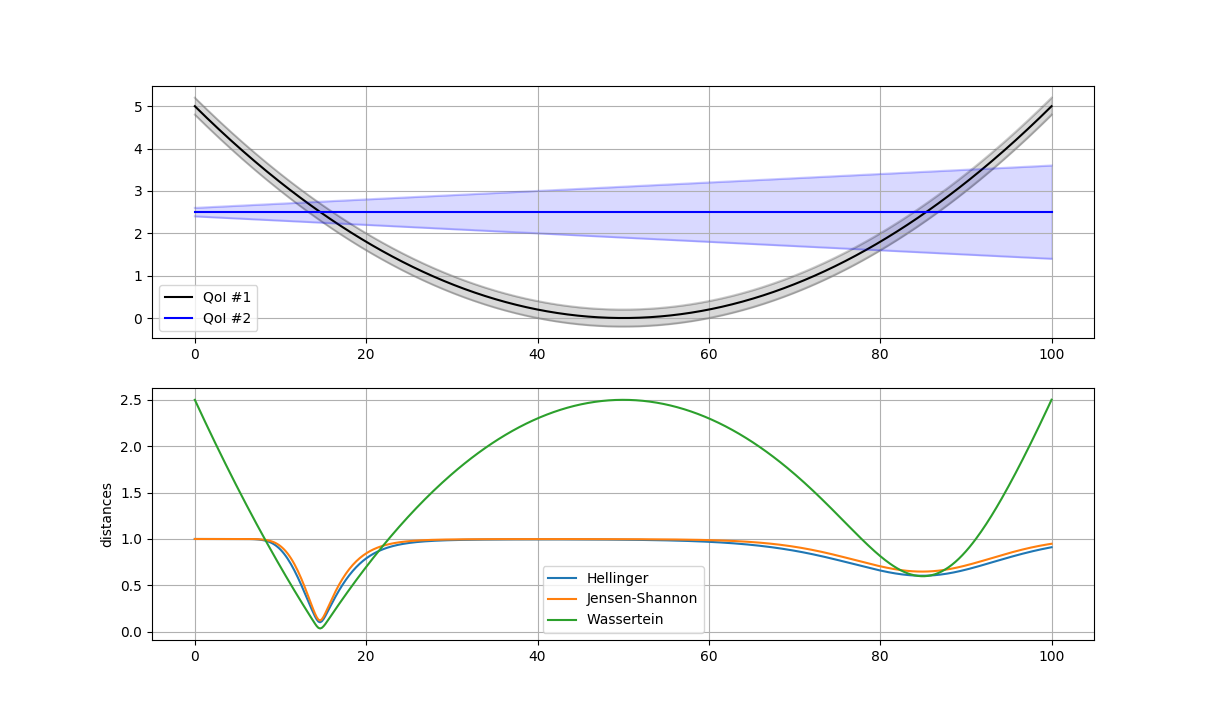
The first two are yielding answers between 0 (zero distance: identical distributions) and 1 (very different), Wasserstein instead are unrestricted with a lower limit of zero.
